This is the last lesson of the R Videotutorial for spatial statistics.
It is all about cokriging in gstat. For this lesson I used the meuse dataset, available within gstat, for the references to this dataset take a look at the script.
The videotutorial is available at this link:
Lesson 6
The script and the dataset for the lesson are available here:
Script
P.S.
Thanks to Gerald that with his email remembered me about this lesson, which I uploaded to the site several days ago but I forgot to mentioned in the blog.
I’m Dr. Fabio Veronesi, data scientist at WRC plc. This is my personal Blog, where I share R code regarding plotting, descriptive statistics, inferential statistics, Shiny apps, and spatio-temporal statistics with an eye to the GIS world.
Wednesday, 13 April 2011
Tuesday, 12 April 2011
Box Plot with ggplot2
Hi,
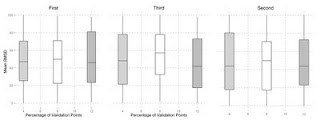
in these days I'm creating lots and lots of box plot with ggplot2.
The look of them is really good and you can change every bit of code so that you can customize the plot completely.
Here is the code I'm using with a test data file to try it:
BoxPlot.zip
The result looks like this:

in these days I'm creating lots and lots of box plot with ggplot2.
The look of them is really good and you can change every bit of code so that you can customize the plot completely.
Here is the code I'm using with a test data file to try it:
BoxPlot.zip
The result looks like this:

Subscribe to:
Comments (Atom)