For
Christmas I decided to treat myself with an Arduino starter kit. I started
doing some basic experiments and I quickly found out numerous website that sell
every sort of sensor: from temperature and humidity, to air quality.
Long story short, I bought a
bunch of sensors to collect spatial data. I have a GPS, accelerometer/magnetometer,
barometric pressure, temperature/humidity, UV Index sensor.
Below is the picture of the
sensors array, still in a breadboard version. Of course I also had to use an
Arduino pro mini 3.3V and an openlog to record the data. Below the breadboard there
is a 2200mA lithium battery that provides 3.7V to the Arduino pro mini.

With this system I can collect 19
columns of data: Date, Time, Latitude and Longitude, Speed, Angle, Altitude,
Number of Satellites and Quality of the signal, Acceleration in X, Y and Z,
Magnetic field in X, Y and Z, Temperature, Humidity, Barometric Pressure, UV
Index.
With all these data I can have
some fun testing different plotting method on R. In particular I was interested
in plotting my data on Google Maps.
These are my results.
First of all I installed the
package xlsx, because I have to first import the data into Excel for some
preliminary cleaning. Sometimes the satellite sensor loses the connection and I
have to delete those entries, or maybe the quality of the signal is poor and
the coordinates are not reliable. In all these case I have to delete the entry
and I cannot do it in R because of the way the GPS write the coordinates.
In fact, the GPS
library, created by Adafruit, writes the coordinate in a format similar to
this: 4725.43N 831.39E
This is read into a string format
in R, so it requires a visual inspection to get rid of bad data.
This format is a combination of
degrees and minutes, so it needs to be cleaned up before use. In the example
above, the real coordinate in decimal degrees in calculated using the following
formula:
47 + 25.43/60 N 8 + 31.39/60 E
Luckily, the fact that R
recognises it as a string facilitates this transformation. With the following
two lines of code I can transform each entry into a format that I can use:
UPDATE 28.02.2014:data$LAT <- as.numeric(substr(paste(data[,"Lat"]),1,2)) + as.numeric(substr(paste(data[,"Lat"]),3,7))/60data$LON <- as.numeric(substr(paste(data[,"Lon"]),1,1)) + as.numeric(substr(paste(data[,"Lon"]),2,6))/60
I found this website http://arduinodev.woofex.net/2013/02/06/adafruit_gps_forma/ where the author suggest a function to convert the coordinates in decimal degrees directly within the arduino code. I tried it and it works perfectly.
Then I assign these two columns as coordinate for the file with the sp package and set the projection to WGS84.
Now I can start working on
visualising the data. I installed two packages: plotGoogleMaps and RgoogleMaps
The first is probably the
simplest to use and let the user create a javascript page to plot the data from
R to google maps through the google maps API. The plot is displayed into the
default web browser and it looks extremely good.
With one line of code I can plot
the temperature for each spatial point with bubble markers:
plotGoogleMaps(data,zcol="Temp")
"Temp" is the name of the column in the SpatialPointsDataFrame that has the temperature data.

By adding an additional line of
code I can set the markers as coloured text:
ic=iconlabels(data$Temp, height=12)
plotGoogleMaps(data,iconMarker=ic,zcol="Temp")

The package RgoogleMaps works
differently, because it allows the user to plot google maps as background for
static plots. This creates less stunning results but also allows more
customisation of the output. It also requires a bit more work.
In this example, I will plot the
locations for which I have a data with the road map as background.
I first need to create the map
object and for centre the map in the centre of the area I visited, I used the
bounding box of my spatial dataset:
box<-bbox(data)
Map<-GetMap(center = c(lat =(box[2,1]+box[2,2])/2, lon = (box[1,1]+box[1,2])/2), size = c(640, 640),zoom=16,maptype = c("roadmap"),RETURNIMAGE = TRUE, GRAYSCALE = FALSE, NEWMAP = TRUE)
Then I need to transform the
spatial coordinates into plot coordinates:
tranf=LatLon2XY.centered(Map,data$LAT, data$LON, 16)x=tranf$newXy=tranf$newY
this function creates a new set
of coordinates optimised for the zoom of the Map I created above.
At this point I can create the
plot with the following two lines:
PlotOnStaticMap(Map)points(x,y,pch=16,col="red",cex=0.5)
as you would do with any other
plot, you can add points to the google map with the function points.

As I mentioned above, this
package creates less appealing results, but allows you to customise the output.
In the following example I will compute the heading (the direction I was
looking at) using the data from the magnetometer to plot arrows on the map.
I computed the heading with these
lines:
Isx = as.integer(data$AccX)
Isy = as.integer(data$AccY)
heading = (atan2(Isy,Isx) * 180) / piheading[heading<0]=360+heading[heading<0]
I did not tilt compensated the
heading because the sensor was almost horizontal all the times. If you need
tilt compensation, please look at the following websites for help:
http://theccontinuum.com/2012/09/24/arduino-imu-pitch-roll-from-accelerometer/
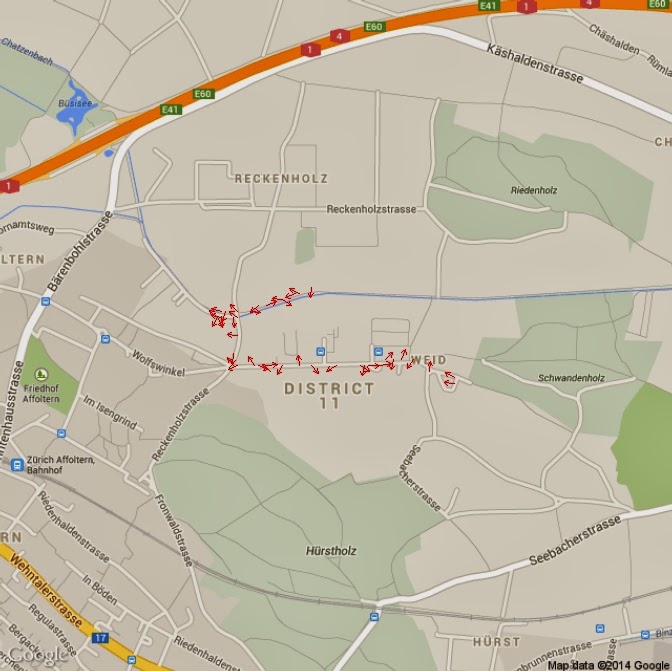
With the heading I can plot
arrows directed toward my heading with the following loop:
PlotOnStaticMap(Map)for(i in 1:length(heading)){
if(heading[i]>=0 & heading[i]<90){arrows(x[i],y[i],x1=x[i]+(10*cos(heading[i])), y1=y[i]+(10*sin(heading[i])),length=0.05, col="Red")}
if(heading[i]>=90 & heading[i]<180){arrows(x[i],y[i],x1=x[i]+(10*sin(heading[i])), y1=y[i]+(10*cos(heading[i])),length=0.05, col="Red")}
if(heading[i]>=180 & heading[i]<270){arrows(x[i],y[i],x1=x[i]-(10*cos(heading[i])), y1=y[i]-(10*sin(heading[i])),length=0.05, col="Red")}
if(heading[i]>=270 & heading[i]<=360){arrows(x[i],y[i],x1=x[i]-(10*sin(heading[i])), y1=y[i]-(10*cos(heading[i])),length=0.05, col="Red")}
}
I also tested the change of the
arrow length according to my speed, using this code:
length=data$Speed.Km.h.*10for(i in 1:length(heading)){if(heading[i]>=0 & heading[i]<90){arrows(x[i],y[i],x1=x[i]+(length[i]*cos(heading[i])), y1=y[i]+(length[i]*sin(heading[i])),length=0.05, col="Red")}if(heading[i]>=90 & heading[i]<180){arrows(x[i],y[i],x1=x[i]+(length[i]*sin(heading[i])), y1=y[i]+(length[i]*cos(heading[i])),length=0.05, col="Red")}if(heading[i]>=180 & heading[i]<270){arrows(x[i],y[i],x1=x[i]-(length[i]*cos(heading[i])), y1=y[i]-(length[i]*sin(heading[i])),length=0.05, col="Red")}if(heading[i]>=270 & heading[i]<=360){arrows(x[i],y[i],x1=x[i]-(length[i]*sin(heading[i])), y1=y[i]-(length[i]*cos(heading[i])),length=0.05, col="Red")}}
However, the result is not
perfect because in some occasions the GPS recorded a speed of 0 km/h, even
though I was pretty sure to be walking.
The arrow plot looks like this:
Thoroughly enjoyed the post. This sparked ideas about collecting spatial data within the confines of teaching. Questions more on the device: (1) where would one get a device that gives all this terrific info (I'm not supper tech savvy so building it wouldn't be my favorite but...) (2) how sensitive is the data? So you give coordinates on a map. Would this work with movement within a classroom (or any small space for that matter)? Would it give sensitive enough info? (3) any chance you could supply some of the data so we can play with your code (maybe you did and I missed it)?
ReplyDeleteI do not think building such an array of sensors would be particularly challenging. I started working with an Arduino as a hobby after last Christmas and I was able to create my first prototype in hours. It is extremely easy. On this array I used an arduino pro mini, which is slightly more advanced that the normal arduino uno, but you can use the arduino uno and the result will be the same thing, just a bit bigger (like 4-5 cm2 bigger).
DeleteI also think it should be sensitive enough to be used in a classroom. I tried it at home and it can see 8 satellites indoors. However the error on a normal GPS should be around 5m so it would probably be wiser to use it in bigger spaces, maybe around the school.
I will post a link to the data I used so you can have a go with them.
These are the data:
Deletehttp://www.fabioveronesi.net/Test_Data.csv
This is SO COOL! Where do you get the sensors, please? (that is, what would I ask for, please?)
ReplyDeleteThank you!
I bought most of the sensors from Adafruit (https://www.adafruit.com/) and some from Sparkfun (https://www.sparkfun.com/). These are probably the main produces of arduino sensors.
DeleteI found the UV sensor in China (http://www.dfrobot.com/index.php).
This post is very nice. There is a small typo. When the string 4725.43N is converted as 47 + 25.13/60 N, it should be 25.43, I guess.
ReplyDeleteYou are right, thanks!
DeleteI corrected the error and I also added an update with a function I found on this website: http://arduinodev.woofex.net/2013/02/06/adafruit_gps_forma/
to convert the coordinates directly in the Arduino code.
This comment has been removed by the author.
ReplyDeleteThis comment has been removed by the author.
ReplyDelete